The Pressure-Volume Behaviour of Gas in a Balloon
Almost everyone has blown up a balloon. Based on your experience, you should be able to
make a prediction about how the pressure in the balloon will increase as you blow more air
into it. Eventually if you blow enough air into the balloon, it will break. In this
experiment you will collect quantitative data to show how the pressure in the balloon
changes as you put in more air.
Materials:
- CBL and Pressure gauge
- Vinyl tube with attached LuerLok tip
- Large volume syringe (35 mL or more)
- Small balloon
- Elastic band
Prelab:
Predict how the pressure of the gas in the balloon will change as you blow it up. Do
this by sketching a graph of what you think the change in pressure will be as the volume
increases. Put P on the vertical axis and V on the horizontal. Show your sketch to your
instructor and explain it before you start the procedure.
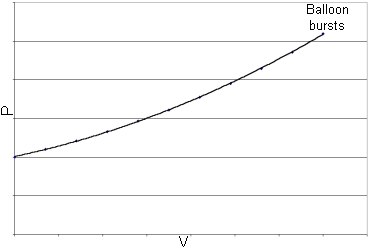
| Here is an example of a possibility: This graph is based on the idea
that the pressure will increase as we put more air in the balloon. Notice that the graph
isn’t a straight line, because the pressure rises faster as we get more air in the
balloon.
Make your own prediction -- this one may not be right (but then again, maybe it is!)
Make sure you think out clearly what you predict will happen. . . |

Figure 1 |
Procedure:
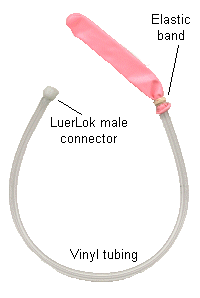
| 1. Insert the vinyl tubing into the neck of the balloon. Using an elastic band,
tightly seal the neck of the balloon to the vinyl tubing. Attach the balloon to one end of
the three-way valve on the pressure gauge. |

Figure 2 |
| 2. Set up the CBL to measure pressure. Select appropriate pressure units. Use the
option to collect TRIGGER/PROMPT data. |
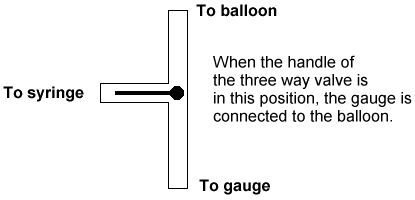
| 3. Open the three-way valve to the atmosphere, and then close it so that
the balloon is connected to the pressure gauge. Press [TRIGGER] on the CBL to measure the
pressure, and enter a value of 0 (the volume) on the calculator. Then set the CBL to
collect more data. |

Figure 3 |
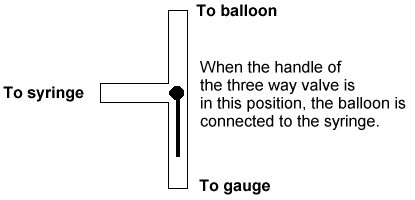
| 4. With the syringe detached from the LuerLok, fill it to the top
calibration mark (35 mL on a 35 mL syringe). Now attach the full syringe to the
other connection on the pressure gauge (the one marked "to syringe" in the
drawing). Open the three way valve to the syringe, push the plunger all the way in,
and then open the valve back to the balloon position (see figure 3). |

Figure 4 |
5. Press [TRIGGER] on the CBL, and record the volume of 35 mL (or the appropriate value
from your syringe). Detach the syringe, refill it with air, and repeat step 4. Measure
each pressure, and record each total volume (70, 105, 140, … if using a 35 mL
syringe). Keep going until the balloon breaks.
6. When you have gathered all the data, select the list data option from the calculator
menu. Press the [STAT] button and record the data points (V is in L1, P in L2 on a TI82
calculator).
Analysis:
1. Plot a graph of P as a function of V (P on the vertical, and V on the horizontal
axis).
2. If you have done a Boyle’s law experiment, compare this graph to a P versus V
graph for Boyle’s law (if you have not done this experiment, you can find an example
of this graph in almost any beginning chemistry text). Is your graph the same?
3. Explain what causes your graph to have the shape it does.
Copyright © 1998 - 2008 David Dice
![]() .
.


