Scientific Graphing Principles


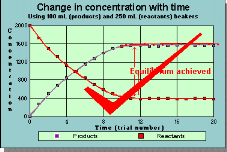
- Each data point must be represented by a visible
symbol. A tiny pencil dot is not correct.
- One of the basic assumptions of science is that nature behaves in a
regular way. Irregularities in a graph come from experimental error.
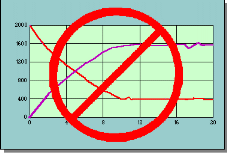
Graphs are always drawn to smooth out any experimental errors in the data. Do not draw the lines connecting the data in "point to
point" fashion. Instead, draw the best fitting smooth curve.
- There must be titles with units (where applicable) on both axes.
- The X (horizontal) axis is the independent variable. Time does not
depend on the amount of water in the container.
- The Y (vertical) axis is the dependent variable. The concentration
changes with time.


