 |
 |
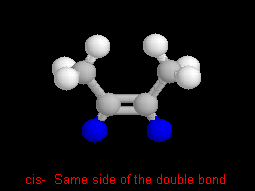
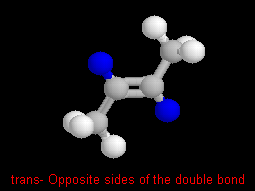
In cis- and trans- isomers there are two parts that are
on the same side (cis-) or across (trans-) a double bond.
For example these are cis- and trans-2-butene (C4H8).
To help you see the relationship of the parts, the hydrogens on the same
(cis) side, or across (trans) the double bond are highlighted
in blue.
 |
 |
| cis-2-butene | trans-2-butene | |
| Melting point |
-138.9 oC
|
-105.6 oC
|
| Boiling point |
3.7 oC
|
0.9 oC
|
| Density | 0.6213 g mL-1 | 0.6041 g mL-1 |
|
|
|
Because the bonds can break apart and recombine, there is an equilibrium
between the two forms which can be represented by this equation: cis-2-butene ![]() trans-2-butene
trans-2-butene
The rate at which the cis molecules turn into trans (the
forward reaction) is
|
The rate at which the trans molecules turn into cis (the
reverse reaction) is
|
You can see this in this Excel spreadsheet2, which you should download and save on your computer. Then open the spreadsheet, and use it to do the following:
1. Observe the spreadsheet graph for these default initial values1:
|
|
2. Change the temperature (make it both higher and lower) and observe what happens to the equilibrium. Explain what you see.
3. Change the size of the activation energies. Make Activation energy (forward) = 60 and Activation Energy (reverse) = 80 (note: this will now be an exothermic reaction). Does Keq depend on the value of kf and kr? Since kf and kr depend on temperature, what can you conclude about the effect of a temperature change on the value of Keq? Is the change the same for an exothermic and endothermic reaction?
4. Reset the temperature and activation energies to their default values. Now double the initial [cis] molecules. What do you observe happens to the graph? Explain what you see.
5. What did you observe happen to the value of Keq in step 4? What can you conclude about the effect of concentration on Keq's value?
6. Make the initial [trans] the same as the initial [cis]. What do you observe happens to the graph? Explain what you see.
7. Reset the default values for temperature and activation energy. Make the initial [trans] = 1.0 mol/L , and set the [cis] = 0. What do you observe happens to the graph? Explain what you see.
8. Compare the results from steps 1 and 7. What can you conclude about a reaction that has reached equilibrium, if you start from the products, as compared to starting with reactants?
9. Does the rate of a reaction become zero when it has reached equilibrium? Explain your answer.
2 This
spreadsheet is a modification of one created by Larry Brown, Texas
A&M University, Department of Chemistry, P. O. Box 300012, College
Station, TX 77842-3012